Pipexe
A GIS platform for oil & gas field operators — an interactive Leaflet map of the entire pipeline network overlaid on satellite imagery, in-browser pipeline drawing and editing, a role-based inspection workflow, and an analytics dashboard for wells, manifolds, and lines.
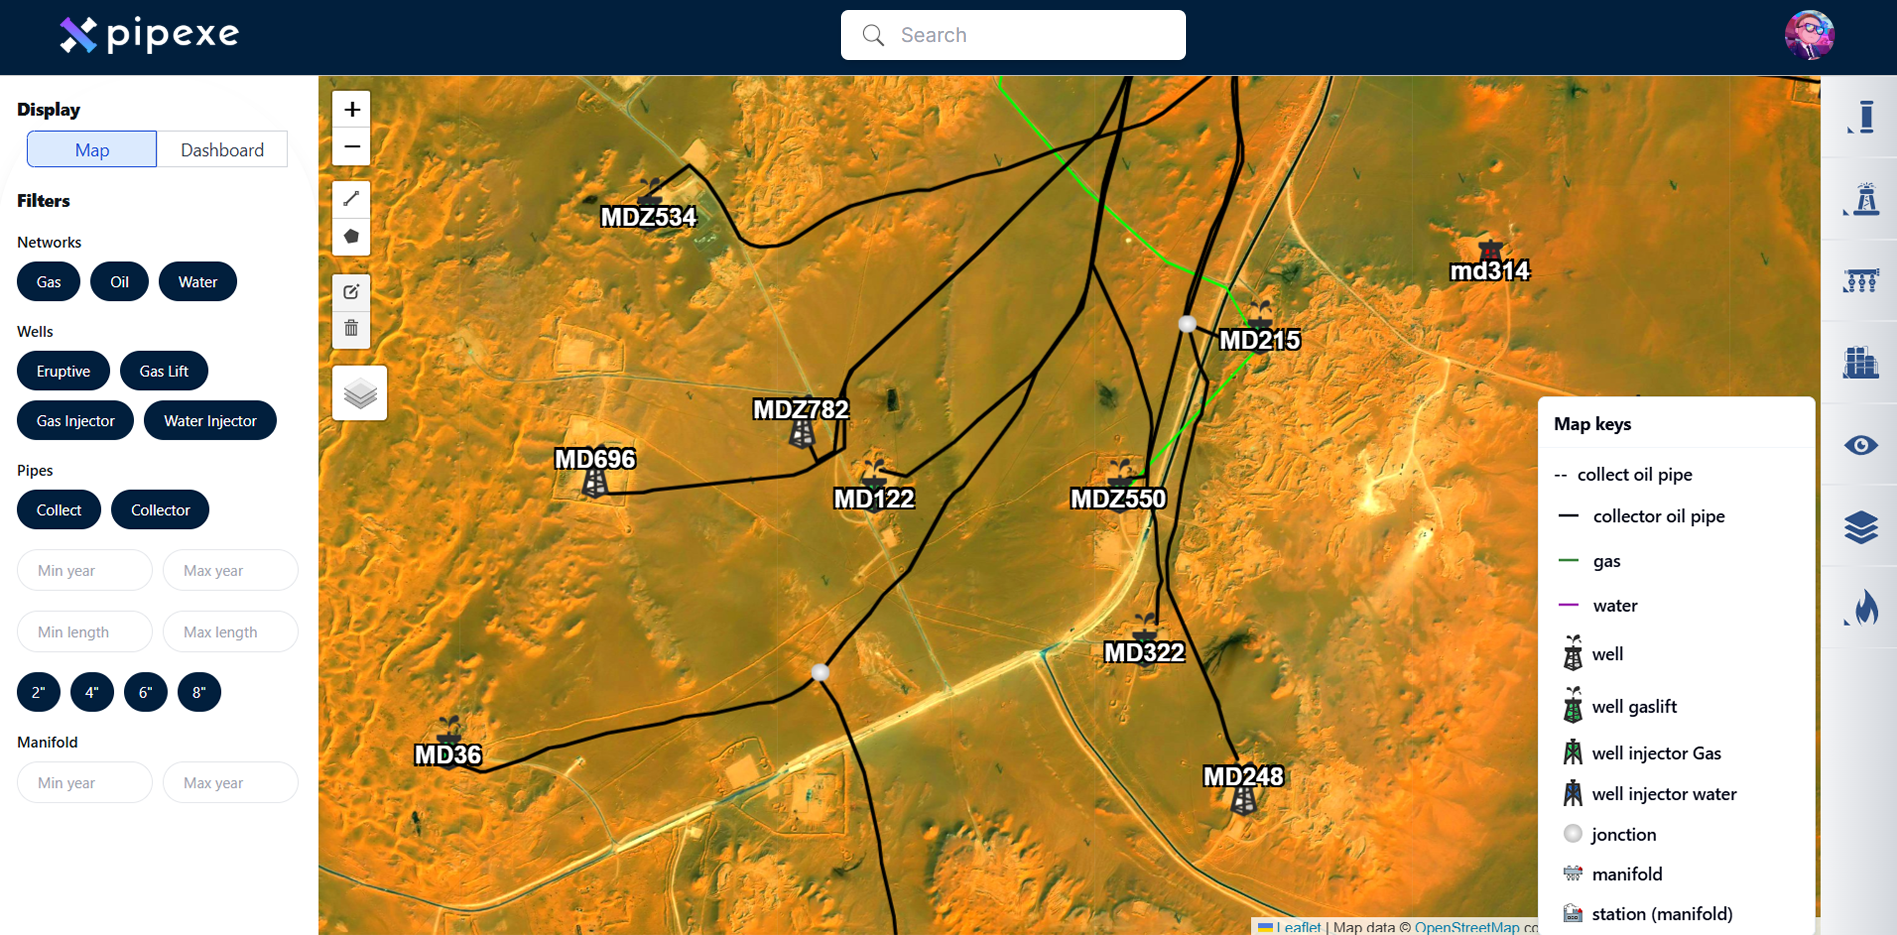
Pipexe is an internal GIS tool built for a field operator to visualize and manage its entire oil & gas surface network — wells, manifolds, junctions, stations, and the gas, oil, and water pipelines connecting them — on a single interactive map layered over satellite and OpenStreetMap imagery.
Interactive Network Map
Every asset is plotted with a distinct icon per type and status: eruptive wells, gas-lift wells, gas and water injectors, manifolds, junctions, and stations, each with an in-service and out-of-service variant. Pipelines are rendered as color- and pattern-coded polylines — solid for collector lines, dashed for collect lines, and colored by fluid (black for oil, lime for gas, blue for water). A filter panel lets operators toggle entire networks, well types, pipe categories, and diameter sizes on or off, so a dense field can be narrowed down to just the layer that matters for a given task. Clicking any well, manifold, or pipe segment navigates straight to its detail page.
Pipeline Drawing & Editing
New pipelines are drawn directly on the map using a Leaflet Draw toolset embedded in the map itself, rather than through a separate form. As a line is drawn, its total length is computed in real time with a haversine great-circle distance calculation. A drawn route can then be split into multiple physical pipe segments by target distance — the tool walks the polyline, interpolating a new coordinate wherever a segment boundary falls between two drawn points — so a single sketched route can become several correctly-measured pipe records in one pass.
Inspection Workflow
A separate inspection module tracks the operational side of the network. Field engineers can raise inspection requests, schedule recurring periodic inspections, upload construction and inspection reports, and follow each report through its status lifecycle. Access is role-based — the request and upload flows are only exposed to the field-engineer ("ep") role — and a stats view rolls inspection activity up into an at-a-glance summary.
Dashboard & Analytics
The same view that hosts the map can switch into a dashboard mode, replacing the live network with charted breakdowns of wells, manifolds, and lines — built with Recharts and backed by the same data the map itself consumes, so the two views always stay in sync.
Tech Stack
Next.js 14, React, Leaflet, React Leaflet, Leaflet Draw, NextUI, Material UI, Radix UI, Tailwind CSS, React Hook Form, Zod, Recharts, Axios, Socket.IO, JWT